Menu

The online M.P.S. in Data Analytics and Visualization program at the Maryland Institute College of Art (MICA) is a 30-credit hour program, designed to be completed in 15 months while working full time. This program teaches professionals how to present information and data in a visual and meaningful way with the use of graphics, images, and dynamic interactive features. View some of our innovative student capstone projects that are making an impact in the world.
Complete the 30-credit program in just 15 months from the comfort of your home and without having to leave your full-time job.
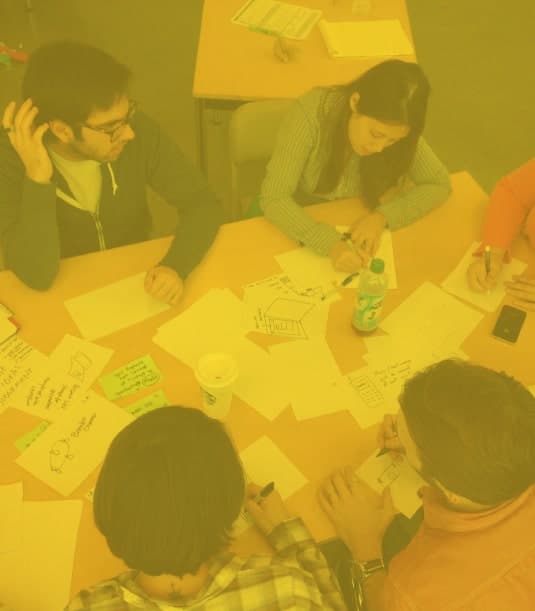
Midway through the program, our virtual industry immersion facilitates collaboration and networking with peers, faculty, guest speakers, and business partners. It combines workshops, keynotes, and hands-on activities for a dynamic experience.
Earn your degree 100% online and study when it works for you. No set class times—just the flexibility to fit learning into your busy schedule.
Employers seek professionals adept at transforming data into visually compelling presentations that enhance understanding and engagement. Get ready to make complex data easy to understand and act on.
Learn from passionate leaders who have built successful careers in data visualization across industries. Benefit from invaluable experience-based teaching models and mentorship, fostering essential skills for your career development.
Demonstrate your strong creative and analytical skills with a compelling portfolio of data visualizations that will impress potential employers.
This fun, online quiz takes 3 minutes to complete and you’ll get a personalized report. Identify your strengths and social style plus information on whether this program is right for you. Get Your Data Analytics and Visualization Program Readiness Score Now
Adjunct faculty member Carly Sinceri shares how MICA’s flexible online Master of Professional Studies in Data Analytics and Visualization empowers creative professionals to advance their careers without putting their lives on hold.
In almost every industry or sector, data is the foundation of sound decisions. But one must know how to analyze and communicate the data to utilize it. Our courses teach the skills and best practices to analyze and communicate data effectively. They also show how to influence actions, strategies, and solutions through data storytelling.
In addition to the courses detailed below, these workshops are offered throughout the program at no additional cost:
Core Skills: Exploring types of visualizations, contextualizing data visualization in the past and present
Core Skills : Excel, Tableau, R, Descriptive statistics, Data cleaning, Data visualization in R
Core Skills:
Core Skills : R (RStudio, R Markdown), Descriptive statistics (continued)
Core Skills :: Adobe Illustrator, Gestalt laws & Universal principles of design
Core Skills: Storytelling techniques, Human-centered design, Storyboarding/wireframing, Interactive visualizations (Intro to D3), Tableau
The virtual industry immersive occurs at the midpoint of the program and enables you to collaborate with your cohort and network with each other as well as industry professionals. It consists of a mix of workshops, keynotes, and hands-on activities. This two-day experience surveys concepts, tools, and techniques that promote innovation. Students engage in exercises designed to apply and test creative techniques. At the conclusion of the virtual industry immersive, students will have knowledge of and practice with a number of approaches that can be applied through the second half of the program and into their careers.
Core Skills: Project Management, User testing, Prototyping, Critique, Iteration and applying feedback
Core Skills: How Data Visualizations are presented through the synthesis of Skills, Softwares, and Methods. Research, Data Collection and Cleaning, Critique, Applying feedback, Iteration.
Core Skills: Continued critique, Applying feedback, and Iteration. Project management, Narration creation and Storytelling (prototyping to target audience), Presentation skills.


The virtual industry immersive occurs at the midpoint of the program and enables you to collaborate with your cohort and network with each other as well as industry professionals. It consists of a mix of workshops, keynotes, and hands-on activities. This two-day experience surveys concepts, tools, and techniques that promote innovation. Students engage in exercises designed to apply and test creative techniques. At the conclusion of the virtual industry immersive, students will have knowledge of and practice with a number of approaches that can be applied through the second half of the program and into their careers.